How to Track Social Media Traffic


This post is also available in:
![]() Pt
Pt ![]() Es
Es
For publishers, understanding social media traffic isn’t just nice to know—it’s a necessity.
If you’re not tracking your social media traffic, you’re flying blind. Knowing where your visitors come from and how they behave once they hit your site will help you optimize your content, boost engagement, and, ultimately, improve your website’s performance.
In this guide, we’ll break down exactly how to track social media traffic step-by-step—no complicated frameworks or guesswork involved.
Whether you’re new to this or looking for a refresher, we’ve got you covered.
Let’s get started!
What is Social Media Traffic?
Social media traffic refers to visitors who land on your website after clicking a link shared via social media platforms.
Whether from a Facebook post, an Instagram story, a Tweet, or a LinkedIn update, if someone clicks through and visits your site, that’s considered social media traffic.
Organic vs. Paid Social Media Traffic
Not all social media traffic is equal. It falls into two main categories: organic and paid.
- Organic traffic comes from content you share on your social media profiles without financial backing. For example, when you post a link to your latest blog post on your Facebook page, and your followers click on it—that’s organic traffic.
- Paid traffic, on the other hand, comes from advertising. This includes promoted posts, sponsored ads, and other paid campaigns where you pay the platform to show your content to a wider audience. Paid traffic is a powerful tool if you’re looking to scale up quickly, but it’s essential to track both types to get the full picture of your social media performance.

The Big Players: Social Platforms That Drive Traffic
Now, not all social platforms are the same when it comes to driving traffic. Some may bring in more visitors than others, depending on your audience and how active they are on different platforms.
Here’s a quick rundown of the usual suspects:
- Facebook: Still a big player for many websites, especially if you’re sharing articles or blog posts.
- Instagram: Great for visual content and e-commerce, though it relies more on link-in-bio or story features for traffic.
- Twitter (now X): Perfect for quick updates and sharing links to drive traffic, especially for news or timely content.
- LinkedIn: A must if your audience is more professional or B2B focused.
- Pinterest: Ideal if you’re in a visual industry (think food, fashion, anime/manga, or home décor) and want to drive long-lasting traffic through pins.
Telegram: A growing platform with the potential to drive significant traffic, especially through communities and channels. Publishers have used it successfully to grow large audiences and direct them to websites for additional content.
Each platform has strengths –– some may work better for you than others. Tracking social media traffic lets you know which ones are your top performers.

How to Track Social Media Traffic: Step-by-Step
Tracking your social media traffic doesn’t have to be complicated. With the right tools and a few simple steps, you will see exactly where your traffic is coming from, which platforms work best, and how visitors behave once they’re on your site.
Step 1: Set Up Google Analytics
Before you can track any traffic—organic or paid—you need to set up Google Analytics on your website.
Here’s how to do it:
- Sign up for a Google Analytics account.
- Add your website as a property.
- Copy the tracking code provided by GA.
- Insert the tracking code into your website’s header, or use a plugin if you’re using a content management system like WordPress.
Once GA is set up, it will automatically track all incoming traffic, including visitors from social media.
Step 2: Use UTM Parameters to Track Social Traffic
You must add UTM parameters to your URLs to distinguish between different social media traffic sources.
UTM parameters are like labels you attach to your links to track where traffic is coming from and how visitors interact with your site.
Here’s a breakdown of the key parameters:
- Source: This refers to the platform where the traffic originates (e.g., facebook, linkedin, twitter). It’s where your visitors are seeing your content.
- Medium: This describes how the message is being delivered. For example, organic traffic would have “social” or “referral” as the medium, while paid traffic would use “cpc” (cost per click) or “paid_social.”
- Campaign: This is where you label your marketing effort. For example, you could name it “Spring_Promo” or “Facebook_Ads” to reflect the specific campaign running.
For paid campaigns, it’s also recommended to use additional UTM parameters:
- Campaign ID: Use this if you have multiple ad sets or campaigns running and want to track them separately.
- Campaign Content: This can be helpful if you’re testing different ad creatives (e.g., “Register Now” button vs. “Learn More” button).
Example UTM for Organic Social Post:
www.yourwebsite.com?utm_source=twitter&utm_medium=social&utm_campaign=blog_promoExample UTM for Paid Ad:
www.yourwebsite.com?utm_source=facebook&utm_medium=paid_social&utm_campaign=summer_sale&utm_content=register_buttonBy using UTM parameters, you’ll be able to track exactly where your social traffic is coming from, whether it’s from a post or an ad, and even differentiate between various campaigns and creatives.
Step 3: Monitor Social Media Traffic in Google Analytics
Once your UTM-tagged links are in use, you can begin monitoring how well your organic and paid campaigns are performing in Google Analytics.
- Go to Acquisition > Traffic Acquisition.
- Filter by Source/Medium to see a breakdown of your traffic. For example, you’ll see “facebook/social” for organic posts and “facebook/paid_social” for paid ads.
Key metrics to monitor include:
- Sessions: Total visits from each source.
- Bounce Rate: The percentage of visitors who leave without interacting with your site.
- Conversions: Actions like subscriptions, sign-ups, or any other goals you’ve defined in GA.
For paid traffic, look at metrics like Cost per Conversion (if you’ve connected Google Ads or imported ad spend data) to see how efficiently your ads are performing.
Step 4: Set Up Events in Google Analytics 4 (GA4)
To track specific user actions like form submissions, downloads, or button clicks, you’ll need to set up Events in Google Analytics 4. Events are used to track interactions that go beyond just page views, whether the traffic is organic or paid.
- Go to Admin > Property Settings > Events.
- You’ll see existing events like first_visit and page_view. If you want to track custom interactions (like “newsletter sign-up“), click Create Event.
- Set the parameters for the event you want to track.
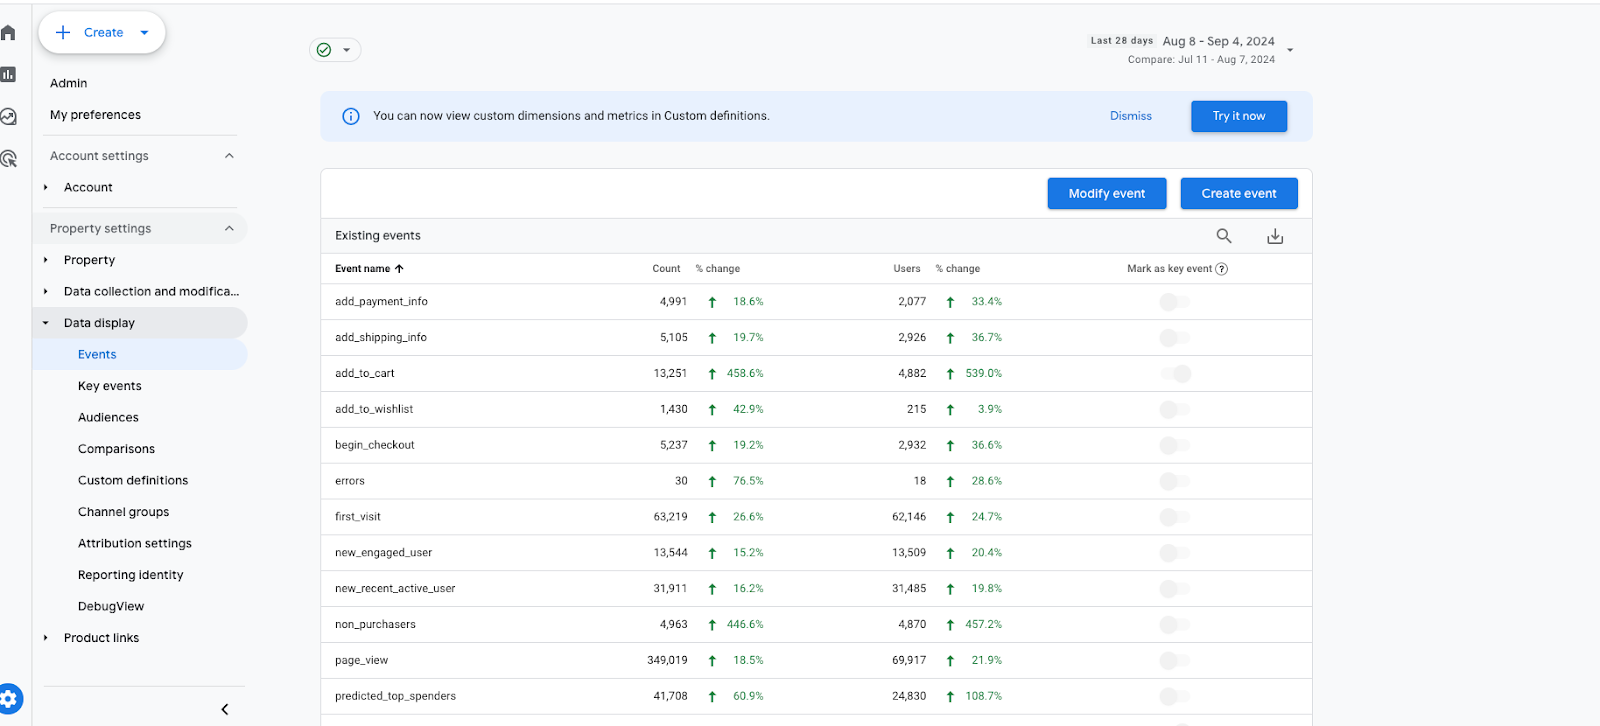
By tracking Events, you can monitor both organic and paid social traffic to see which sources drive meaningful actions on your site.
Step 5: Use Social Media Insights for Additional Data
While Google Analytics provides excellent overall insights, don’t forget to use the analytics tools built directly into each social media platform. These tools are useful for tracking paid ads and understanding how users engage with your content before they click through to your site.
- Facebook Insights: Track engagement, reach, and demographic data for your posts and ads.
- Instagram Insights: Monitor interactions, profile visits, and clicks for both organic posts and paid promotions.
- LinkedIn Analytics: View engagement rates and follower demographics for B2B audiences.
- Twitter Analytics: Track impressions, link clicks, and engagement for tweets and promoted tweets.
Using these native platform tools alongside Google Analytics gives you a fuller picture of your social media performance.

How to Analyze and Interpret Social Traffic Data in GA4
Once you’ve set up tracking for your social media traffic, the next step is to dive into the data.
Google Analytics 4 (GA4) offers powerful insights into how users behave on your site, which social media platforms drive the most traffic, and how that traffic converts into meaningful actions.
1. Understanding Traffic Acquisition Reports
The Traffic Acquisition report is your go-to for understanding how visitors from social media platforms find your site. To access it:
- In GA4, navigate to Acquisition > Traffic Acquisition.
- Filter by Source/Medium to isolate your social media traffic.
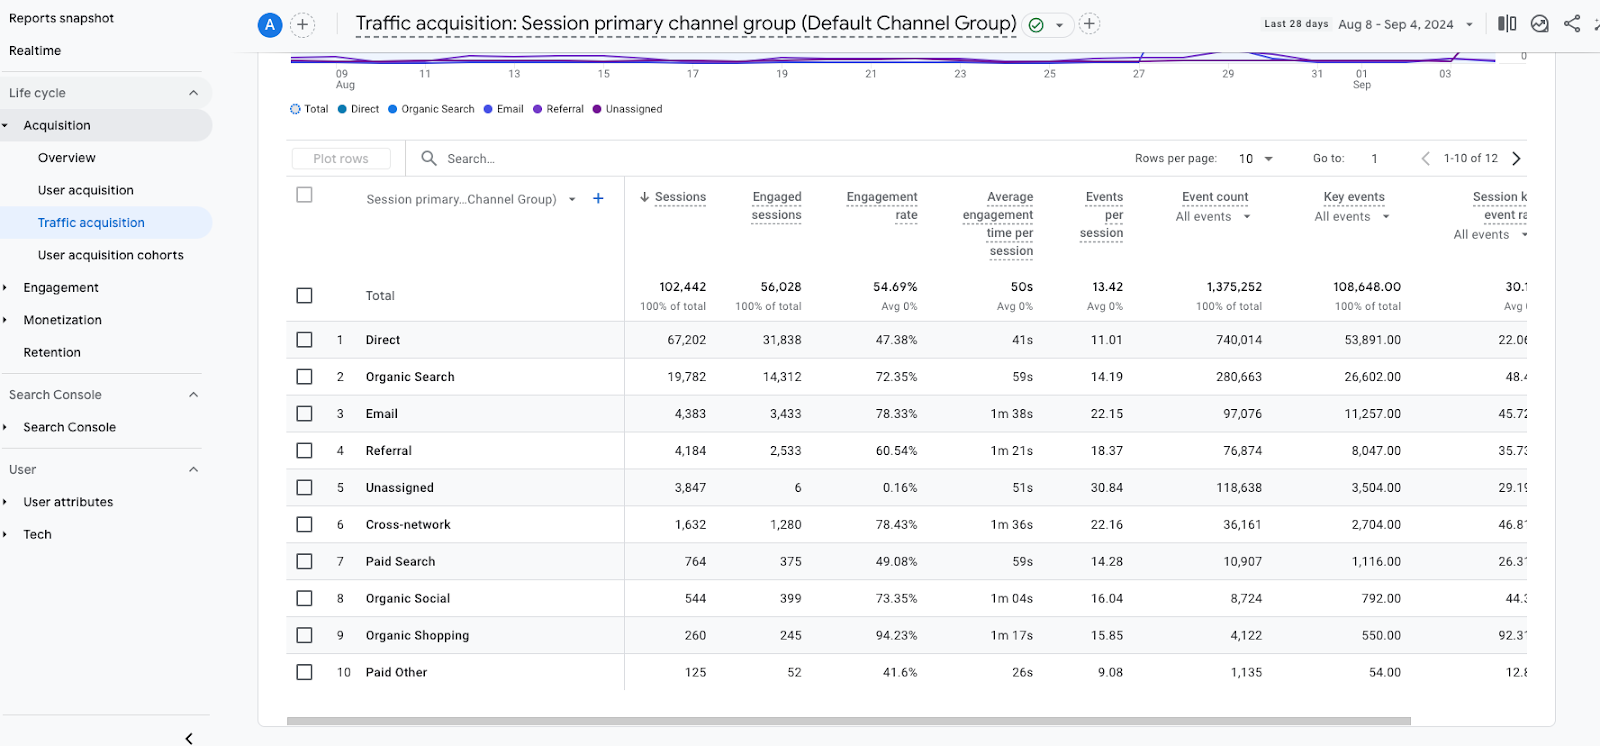
Key metrics to look for:
- Sessions: The total number of visits, including repeat visits from the same user.
- Engagement Rate: The percentage of sessions where users interact with your content (e.g., clicks, scrolls). A high engagement rate suggests that the traffic from social media is highly interested in your content.
- Events: This helps you understand the number of times visitors triggered an important event on your site.
2. Analyzing Behavior Flow
The Behavior Flow report provides a visual map of how users move through your site after clicking through from social media. To access it:
- Go to Explore > Path Exploration in GA4.
Here’s what to look for:
- High-Engagement Pages: Identify which pages visitors from social media are most engaged with. Do certain posts or landing pages keep users around longer? The best practice here is to display ads on the most frequently visited web-pages.
- Drop-Off Points: Find out where users tend to leave your site. Are there pages where users lose interest or get stuck? These drop-offs can signal areas where you need to improve content or optimize user experience.
3. Tracking Conversions and Events
Beyond visits and page views, you’ll want to know which social media visitors are completing important actions on your site. This is where Events come in handy.
To view Events:
- Go to Reports > Engagement > Events.
- Filter by source/medium
In GA4, Events track specific user interactions, such as:
- Button clicks (e.g., “Register” or “Read More”).
- Video plays.
- Form submissions (e.g., signing up for a newsletter).
By analyzing the Events report, you can see which social platforms are driving the most valuable actions on your site. For example, you might find that Facebook is great for driving sign-ups, while Instagram is better for product views.
If you want to track custom conversions (like when someone adds an item to a cart or watches a certain percentage of a video), you can set up Custom Events to track these specific interactions.
4. Attribution Models in GA4
One of the most useful features of GA4 is its flexible Attribution Models. These models help you understand which traffic sources (like social media platforms) deserve credit for a conversion. A conversion can be anything important to you, like a registration or a sign-up.
Here are a few attribution models available in GA4:
- Last Click: This model gives all the credit for a conversion to the last interaction a user had before they completed an action. For example, if someone clicked a link in a tweet and then made a registration, Twitter would get 100% of the credit.
- First Click: In this model, all the credit goes to the first interaction a user had. So if someone clicked a Facebook ad first, and later completed a sign-up, Facebook would get all the credit—even if they visited your site through other links later.
- Linear: This model spreads the credit evenly across all the touchpoints. If a user clicks on several links (e.g., Twitter, Facebook, and a newsletter) before converting, each one gets an equal share of the credit.
GA4 also offers a Data-Driven attribution model, which uses machine learning to analyze all the interactions across your site and distribute credit accordingly. This is particularly useful when you’re running multiple campaigns across different social platforms and want a clear understanding of which one is most effective in the overall conversion path.
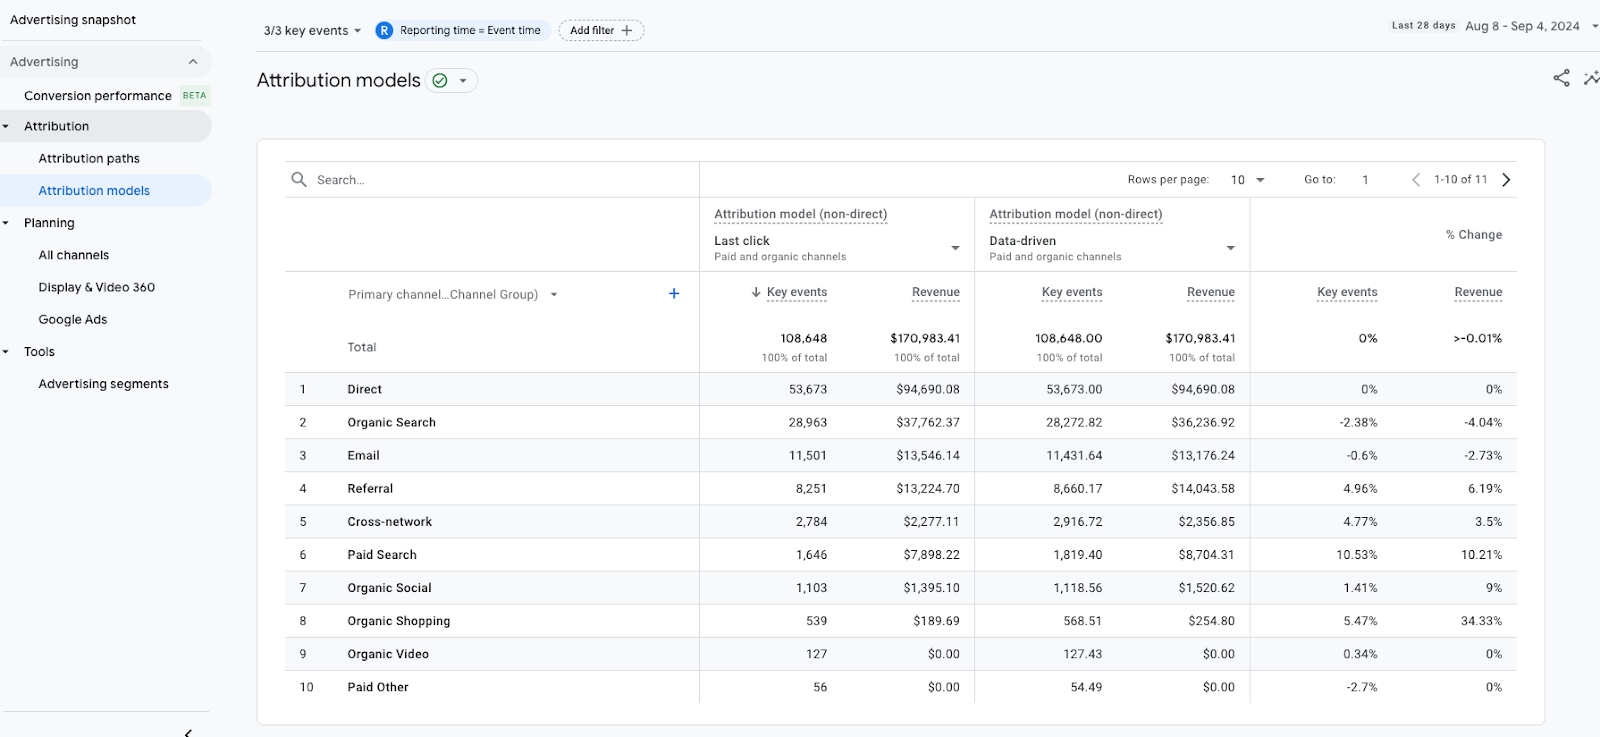
In the screenshot, you can see a comparison between the Last Click and Data-Driven attribution models. The Last Click model gives all the credit for conversions to the final interaction, while the Data-Driven model distributes credit across all touchpoints, providing a more complete view of what influenced the conversion.
Recommendation: For a more accurate understanding of how different channels contribute to conversions, especially if you’re running multi-channel campaigns, use the Data-Driven model. It helps you see the full customer journey, not just the final step.
5. Segmenting Social Media Traffic for Deeper Insights
Segmentation is one of the most powerful tools in GA4. It allows you to drill down into specific slices of your social media traffic, providing deeper insights.
To create a custom segment:
- In GA4, go to Explore and click on Funnel Exploration.
- Create segments based on criteria like platform (e.g., Facebook, LinkedIn), campaign (e.g., Spring_Promo), or user behavior.
Some useful segmentation options:
- Organic vs. Paid: Compare the performance of organic posts vs. paid ads. Are paid campaigns driving more conversions, or are organic posts bringing in more loyal users?
- Device Type: Check how social media visitors are behaving based on whether they’re using mobile or desktop. You might find that certain platforms work better on mobile, which can inform your design and marketing strategies.
- Geography: Segment users by location to see how your social media traffic performs in different regions. This is especially useful if you’re targeting specific markets.
By breaking your traffic into segments, you’ll be able to make more targeted decisions—like adjusting ad spend on a specific platform or optimizing content for mobile users.
6. Using GA4 Insights for Decision-Making
Finally, once you’ve analyzed all this data, it’s time to put it to use. Here’s how GA4 insights can help you make better decisions:
- Content Strategy: Identify which types of content are resonating the most with your audience. Are Instagram stories driving the most traffic? Maybe it’s time to invest more in that format. Or perhaps blog posts shared on LinkedIn are converting better—lean into that.
- Ad Optimization: Use the insights from your Attribution Model reports to optimize your paid campaigns. If you notice that Facebook ads drive initial interest but Twitter converts better, you can adjust your ad budget accordingly.
- Landing Page Improvements: Use the Behavior Flow report to see where users are dropping off and make adjustments to your landing pages. This could involve tweaking your calls-to-action, improving page load times, or redesigning for better engagement.
How to Use Social Media Insights in Analysis
While Google Analytics gives you an overall view of how social media traffic interacts with your website, each social platform provides its own detailed analytics that can give you even more insight into how users engage with your content before they click through to your site.
Platforms like Facebook, Instagram, LinkedIn, Twitter, and Pinterest offer native analytics tools that track metrics like reach, impressions, engagement (likes, shares, comments), and link clicks. These tools help you understand which posts resonate with your audience, what kind of content performs best, and how users engage with your ads or organic posts.
Here’s a quick breakdown of what you’ll typically find in social media insights:
- Engagement: Measures how users interact with your posts (likes, shares, comments).
- Impressions and Reach: Tracks how many people see your posts.
- Link Clicks: Shows how many people clicked on links within your posts to visit your site.
- Audience Demographics: Provides information on the age, gender, location, and interests of your followers and audience.
For paid campaigns, you’ll also have additional metrics like:
- Click-Through Rate (CTR): The percentage of people who clicked on your ad after seeing it.
- Cost Per Click (CPC): How much you’re paying for each click on your ad.
- Conversion Rate: Measures how many users who clicked your ad took a specific action, like signing up or registration.
Each platform’s tool may display these metrics slightly differently, but understanding both organic engagement and paid performance is crucial to evaluating the success of your social media efforts.

Combining Social Media Insights with Google Analytics
To get the most out of your social media data, you should combine the platform insights with your Google Analytics data. Here’s how:
- Track Social Engagement vs. Website Traffic: Social media insights will tell you how well your posts are performing in terms of engagement, but they don’t always reveal the whole story. High engagement (likes, comments) doesn’t always lead to high traffic. By cross-referencing link clicks from social platform insights with sessions in Google Analytics, you can see whether your engaged social audience is actually visiting your site and how they behave once they arrive.
- Audience Matching: Use the demographic data from platforms like Facebook, Instagram, or LinkedIn to compare with the demographic insights in Google Analytics. This can help ensure that the right people are not only engaging with your posts but also visiting your website. For example, if your audience on LinkedIn is mostly professionals from a specific industry, are you seeing the same group in your GA data? If not, it might be time to adjust your messaging.
- Analyze Organic vs. Paid Performance: Social media platforms will give you data on how your organic and paid content performs, but combining that data with GA helps you dig deeper. For example, Facebook might show a higher click-through rate for your ads, but Google Analytics will reveal which source (paid or organic) brings higher conversions, better engagement, or more valuable actions on your site.
- Evaluate ROI for Paid Campaigns: Social platforms will tell you how your paid campaigns are performing in terms of clicks and cost per click (CPC), but you’ll need Google Analytics to measure the actual ROI. By tracking conversions through Events and Conversion Paths in GA, you can evaluate how much return you’re getting on your ad spend and which platforms are delivering the best value for your marketing budget.
- Optimize Content and Posting Strategies: Look at the Behavior Flow in GA to see how social visitors navigate your site. If you notice drop-offs after users arrive from a certain platform, it could indicate that your content isn’t aligning with their expectations. Combine that with the insights from social platforms on what types of posts are driving clicks, and adjust your content or landing pages accordingly.
3 Actionable Tips for Effective Social Traffic Analysis
- Set Up Custom Segments in Google Analytics to isolate traffic from specific platforms and campaigns. For example, compare Facebook organic traffic to Instagram paid traffic to see which brings in more engaged users.
- Monitor Event Data to track key interactions like newsletter sign-ups or downloads. Use this to assess whether your social media efforts are driving valuable actions on your site, not just visits.
- Test and Refine: Use the insights from both social media platforms and Google Analytics to run A/B tests on your posts and ads. For example, try different creatives or messaging for paid campaigns, and track which version drives the most conversions in GA.

Why Analyzing Social Media Traffic Matters
Tracking and understanding your social media traffic is more than just counting visits—it’s about unlocking valuable insights to drive growth. Whether it’s organic posts or paid ads, knowing how social media traffic behaves on your website helps you optimize your content, boost engagement, and ultimately grow your profits.
By analyzing social media traffic, you can pinpoint which platforms and posts are performing best, allowing you to focus on the strategies that bring the most ROI. You can also see how visitors from different platforms engage with your content, which helps you tailor your website experience to their needs—whether that’s optimizing landing pages or creating more targeted content.
In the end, analyzing your social media traffic allows you to constantly refine and improve your overall strategy. With the insights from tools like Google Analytics and platform-specific analytics, you can make data-driven decisions that lead to more effective social media campaigns and a better-performing website.