Telegram Mini App Metrics: How To Track the Success of Your App?

So you created a mini app, and it’s ready for the soft launch! Or are you already at the scaling stage?
Anyway, no marketing efforts to promote your app make sense if you don’t track the statistics.
But what stats are worth checking? Is Google Analytics enough to get everything you need? How to understand if you are doing well or not?
We have answered all of these questions in this post.
How to Prepare Your Analytics System?
Analytics is important, but it doesn’t mean you need to count every click a user makes in your app. Instead, you need to determine the actions a user is supposed to perform within a single session in your app and check if they really perform them.
So, here is what you must prepare before linking any trackers to your TMA:
- Unit economics. In simple words, you need to plan how much you are most likely to pay for a user who performs a specific action. For example, a user reached Level 10 in your game. It means that they have already completed, say, 10 tasks to follow a channel, which brought you $5. If you paid less for this user, then you are in the black!
- Analytics system. Simply collecting data is not enough. To get insights from your tracking, you need a clear analytics system that shows the results in various slices and allows you to conduct product and marketing analysis. This way, you will see any leaks in your funnels, monitor performance at various traffic channels or GEOs, or spot growth and drop-offs.
Roman Aliev, Operations Manager at BDC Consulting:
At the very beginning, you can collect data manually. But in a perfect scenario, it’s better to have an automated analytical system that will save your time and show precise results in real time.
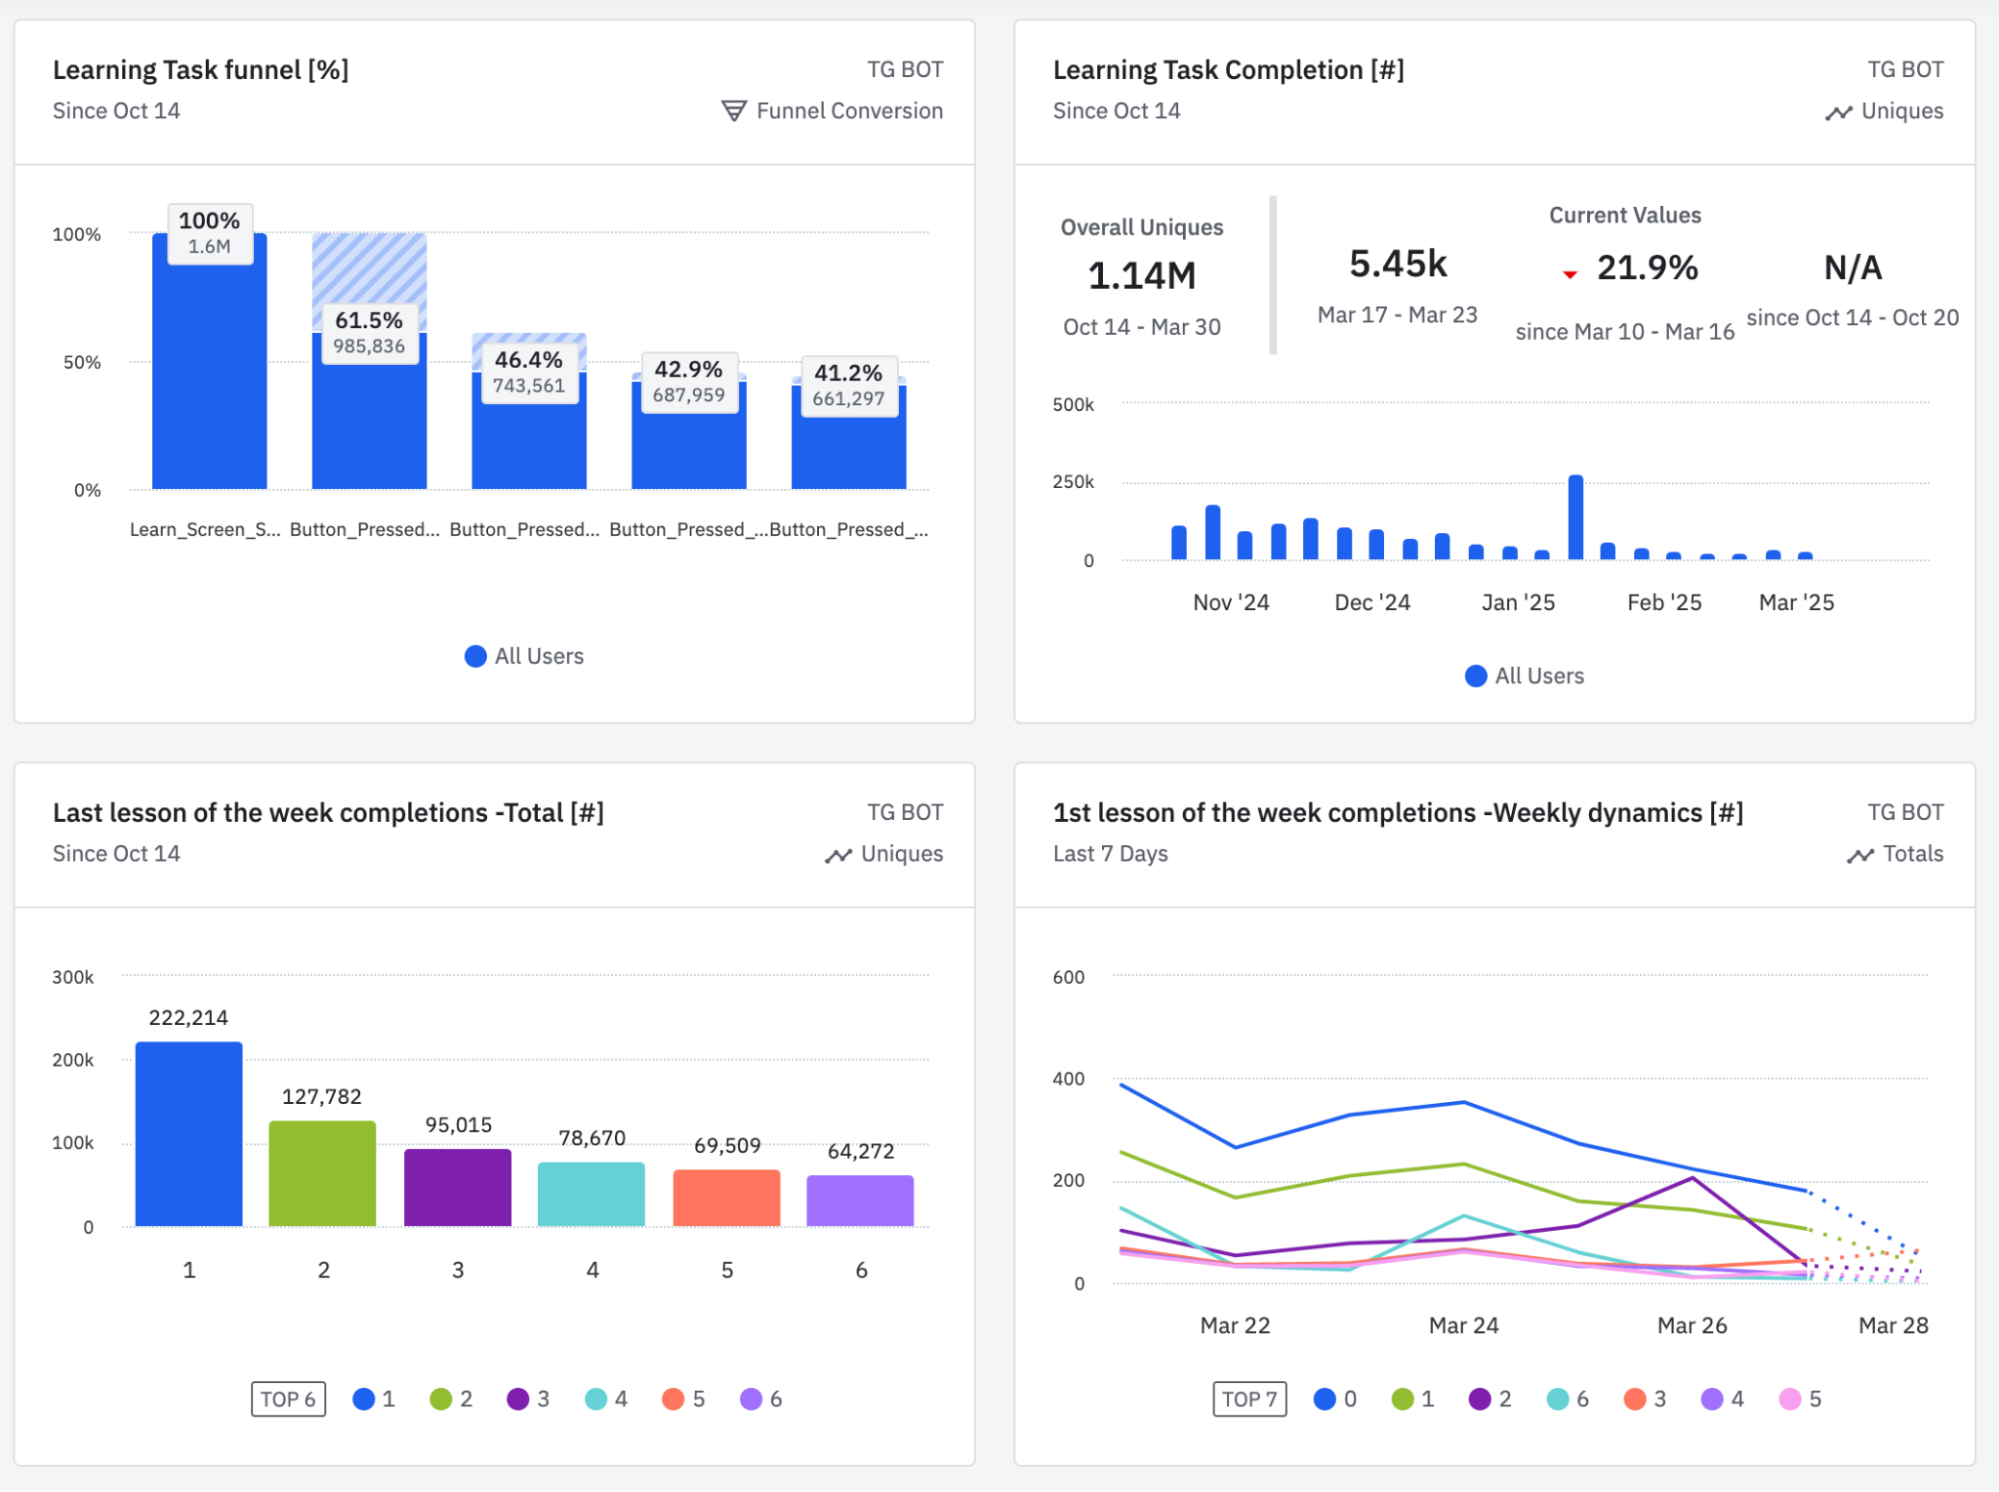
An example of a BDC Consulting analytics system
Besides, you can’t analyze average benchmarks just as they are: they can vary depending on different factors.
Mike Tkal, Founder of FindMini.app:
One of the biggest mistakes app owners make when analyzing their stats is ignoring audience segmentation and analyzing average metrics without taking traffic sources into account.
– Besides, it’s also a mistake to make conclusions based on short timeframes, ignoring user geography and the traffic type (paid/organic).“
What Shall You Track In Your Mini App?
Of course, there are plenty of metrics you might want to measure. However, there are 6 key statistics you can’t do without.
Retention rate
– a measure that shows how many people come back to your app after the first touch and keep actively using it.
According to Roman, this is the most important parameter of a Telegram Mini App ever.
Roman:
Finally, app owners began to track the retention rates of their apps! Before, we only checked MAU and DAU to see how many active users there are daily and monthly. However, these metrics are not so relevant.
– The daily activity might seem extremely high when you constantly send traffic to an app. However, if you don’t count new users who just entered the app and left, the real numbers are much lower, in the end. Meanwhile, the retention rate gives you a real image of how active the users are.”
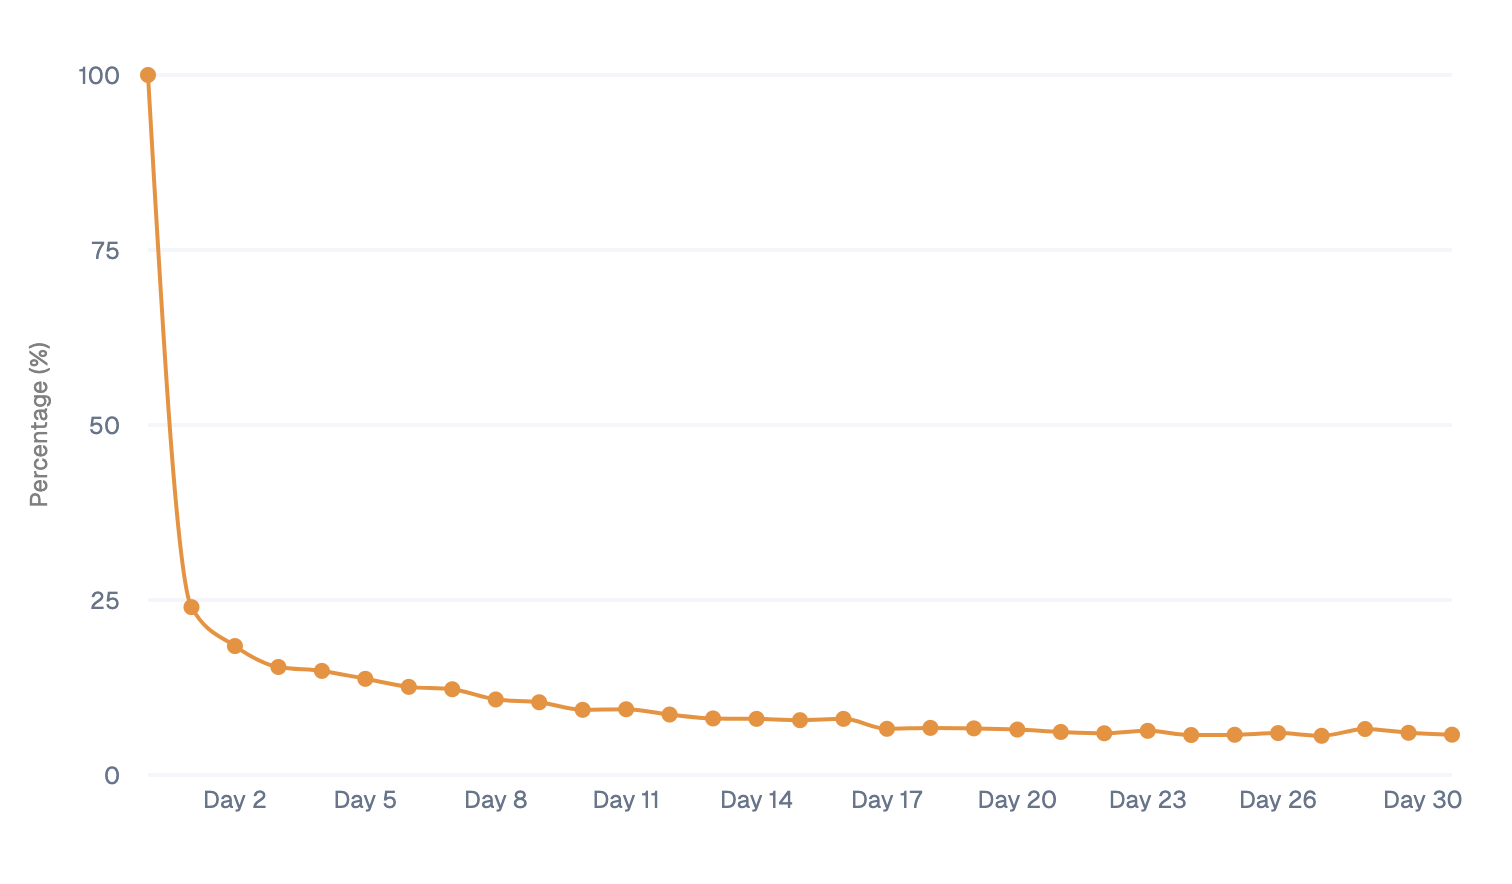
To measure the retention rate, you check the percentage of first-time users who return to your app on days 2, 3, 4, and so on. According to Mike Tkal, the best option is to check the retention rates on Day 1, Day 7, and Day 30.
Mike:
I check the D1, D7, and D30 retention rates, but also track repeat sessions throughout the day and monitor weekly engagement: on Telegram, interaction frequency is everything.
Then, I analyze user drop-off points: whether they happen at the onboarding stage, within key scenarios, or due to external factors (like missing push notifications).“
The average retention rate of Telegram Mini Apps varies from 15% to 20% on Day 1, and from 8% to 10% on Day 7. This is much lower than you usually see with traditional mobile games, where the RR can reach 50%, but this is a product-specific issue.
Roman:
The retention rates might be higher at Utility TMAs, such as social apps. Lately, some Web3 gaming apps have begun showing almost the same RRs as mobile games. In most cases, that’s related to very engaging gameplay.
DAU (daily active users) and MAU (monthly active users)
– The number of unique users who engage with your mini app on a given day or at least once within 30 days.
As we already mentioned, DAU and MAU are important only in the context of returning users – otherwise, that’s just another vanity metric.
Your DAU might be high after you launch an advertising campaign because, apparently, new users will come to your app, and this will create a nice overall picture.
However, the reality is harsher: the genuine average MAU in TMA is 5% of DAU. So, if you have, say, a million daily active users, your MAU will be about 50,000.
Paying User Rate
– a percentage of users who make at least a single in-app purchase compared to the total active daily or monthly users.
The typical benchmarks here vary from 1% to 1,5% from DAU, but this much depends on the app type.
While casual games might have a higher PUR, the Utility apps ( services like social chats) attract users who are less willing to pay.
For example, the once-hyped Hamster Combat had a 2,5% paying user rate.
Besides, it’s a good idea to track the average spend per user, too.
LTV (lifetime value)
– a metric that measures your revenue from a user during the whole time they keep interacting with an app.
This one can show how profitable your project is overall: in a perfect scenario, your LTV must be higher than the user acquisition cost.
Besides, this can help evaluate various traffic sources and see which brings more quality traffic, with a longer lifespan for paying users.
Cost per User
– the average price for attracting a single user.
Here, you might want to track just any user, regardless of their engagement.
However, in many cases, you need to check how much you pay for a user who performed a particular action.
For example, if you begin monetizing users only after they reach Level 5 in your game, it makes sense to check their cost separately.

Extra Metrics To Track
Besides the key metrics, you can also monitor more specific ones, which will allow you to dive deeper into user behavior and optimize your app mechanics or marketing approaches.
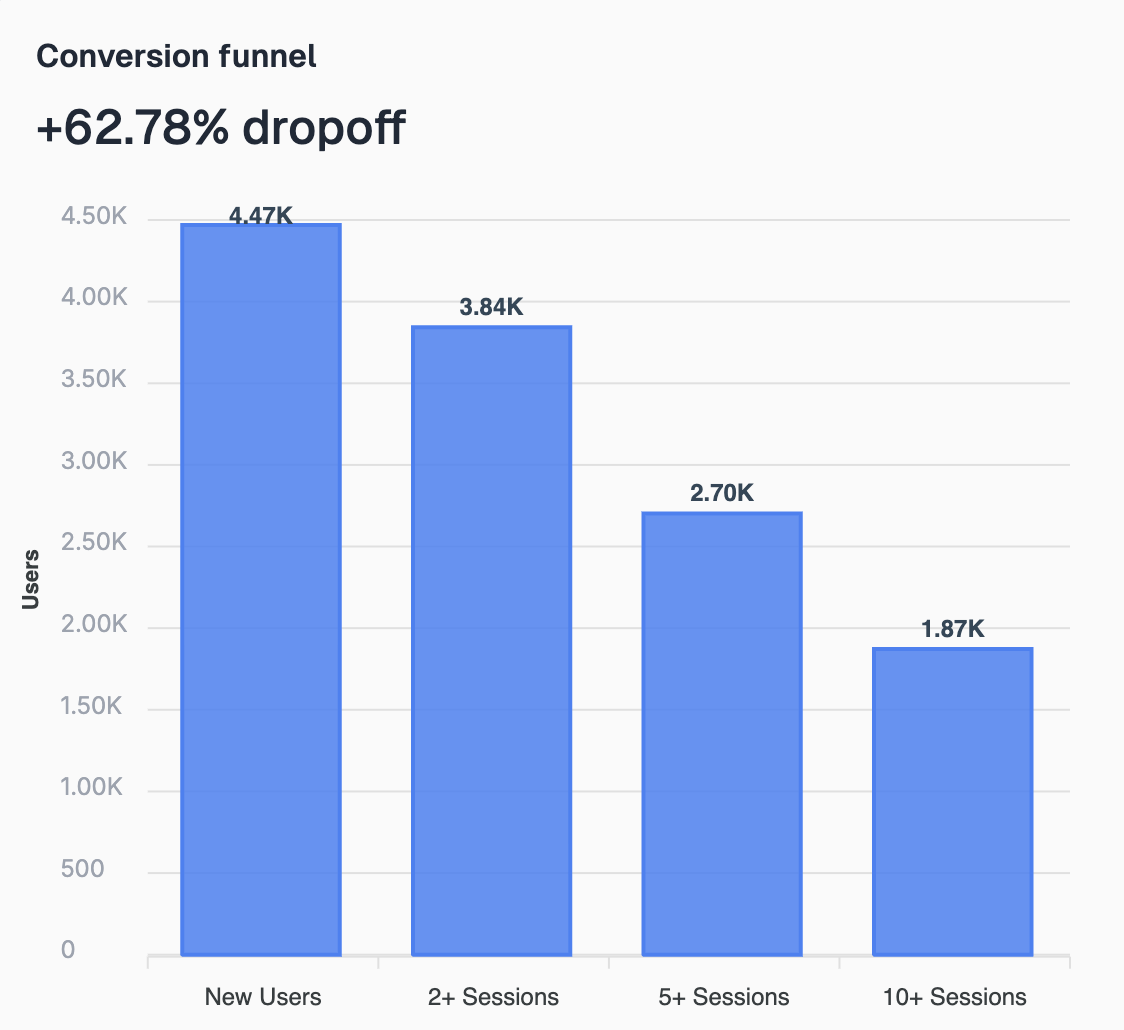
Session depth
– A metric that shows the number of interactions from a user during a single session in your mini app.
This one can include:
- The number of app pages or screens a user viewed
- The number of clicks on a particular screen
- How many times a week/a day user visit an app
- How much time a user spends in the app
K-Factor
– a metric that counts how many users are brought by every existing user.
In other words, this is a virality check: if your K-factor is high enough, it means your mini app is engaging and motivates users to share it with others.
How to Track Your TMA Statistics?
There are plenty of tracking tools, and you are free to choose. If you have no idea of what will work best, let’s rely on the experts’ opinion. Here is the list of the tracking tools used at BDC Consulting:
- TMA Analytics SDK: a tool that collects your mini app statistics and shares your metrics with Telegram Mini App catalogs. This might help attract investors, the primary users of such catalogs.
- Amplitude: a perfect tool to watch statistics in various slices. What’s more, they have a special AI feature that allows you to simply request a particular metric in a chatbot. It might look like ‘Show me the retention rate on day 7’ – and you receive a graph without any manual work involved.
- Telemetree: offers fewer slices to check, but it has another great value. The main value of this tool is on-chain tracking. This means it can integrate with the TON blockchain and track the transactions within it. As a result, you see how many wallets are connected to your app, how much money these wallets have, and the overall transaction volumes.
- Redash: a tool that helps visualize raw data from SQL databases and create interactive dashboards, graphs, and reports for analysis.
To Sum Up
Once you know how to track your TMA stats, you can optimize it, make it simpler or more engaging for users, and thus boost your monetization efforts.